
Sales up more than tenfold, on sixty two percent more traffic.
Traffic went up by sixty two percent. Sales went up by more than nine hundred. Almost none of the growth came from getting more people to the site, which is the whole point of the entry.
- Cockatoo Cocktails
- Ecommerce, drinks
- October to December 2025
- Google Ads, Google Shopping, Meta Ads, SEO, Offer and conversion
The background.
Cockatoo Cocktails sells drinks direct to consumers in Australia. The store was live, the products were good, and people were arriving. Very few of them were buying, and the ones who did were not spending much.
This was not one problem in one channel. Search was putting the site in front of the wrong queries at position thirty two. The Shopping campaigns were structured so budget went everywhere rather than at what sold. And the offer on the site gave a first time visitor no particular reason to decide today.
The problem.
The temptation with a store like this is to buy more traffic. The numbers said that would have been the expensive way to do nothing: visitors were arriving and leaving, so every extra visitor would have left too.
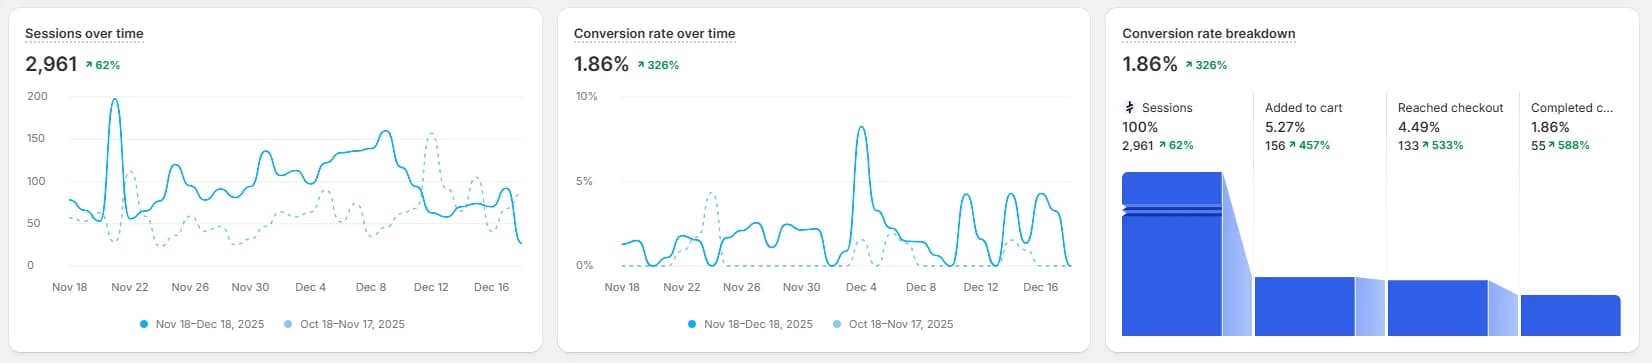
The checkout funnel showed where it broke. Of everyone arriving, a small fraction added to cart, fewer reached checkout, and fewer still finished. Fixing that was worth more than doubling the traffic, and cost less.
- 32.2
- Average position in organic search
- 0.8%
- Search click through rate
- A$3.51
- Average cost per click
- A$76.01
- Cost per conversion
What we did.
Search rebuilt around intent, not volume
- The site was appearing constantly for queries that were never going to buy, which is why the click through rate sat at 0.8% across sixty six thousand impressions. The work moved it toward fewer, better queries. Impressions fell by a third on purpose and clicks went up by half.
Shopping campaigns restructured
- Budget had been spread flat across the catalogue. It was restructured so spend followed what actually sold and what carried margin, rather than treating every product as equally likely to convert.
Google Ads pointed at conversions
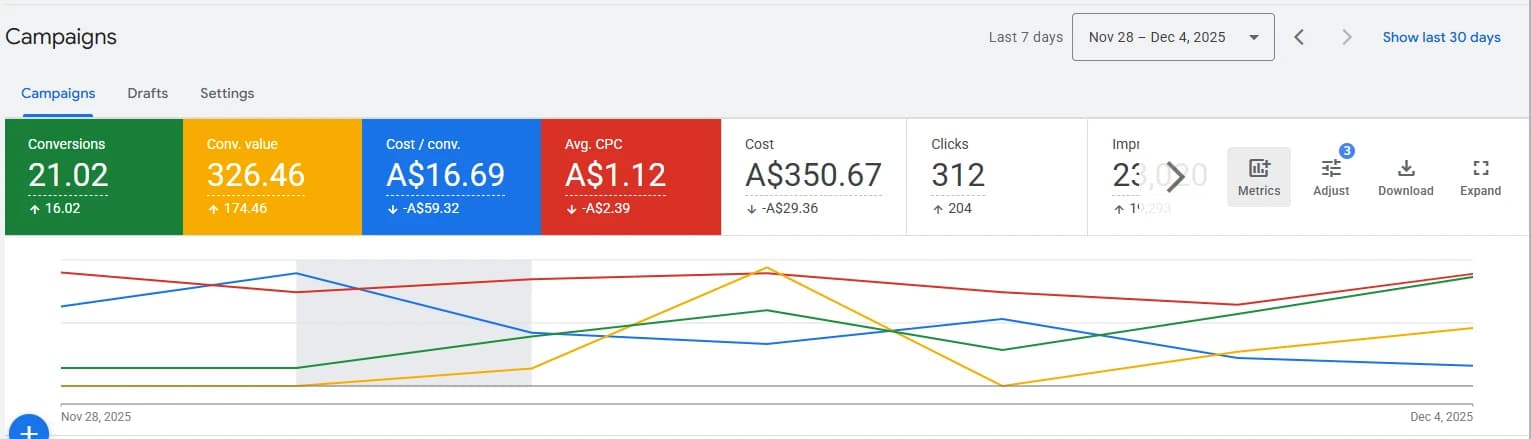
- With the structure fixed, cost per click and cost per conversion both came down hard while clicks went up. The account stopped paying premium prices for traffic that was never the right traffic.
Meta used for the demand search cannot reach
- Nobody searches for a cocktail brand they have never heard of. Meta was run to create that demand, with search and Shopping there to catch it once the name meant something.
The offer given a reason to act
- The largest single lever was not in either ad account. The offer on the site was reworked so that a first time visitor had a reason to decide now rather than later, which is what moved the conversion rate and the average order value at the same time.
The funnel followed all the way to paid
- Add to cart, reach checkout and complete were tracked as three separate problems rather than one conversion rate. All three improved, which is how you know the fix was the path through the site and not just better traffic arriving at the top of it.
The results.
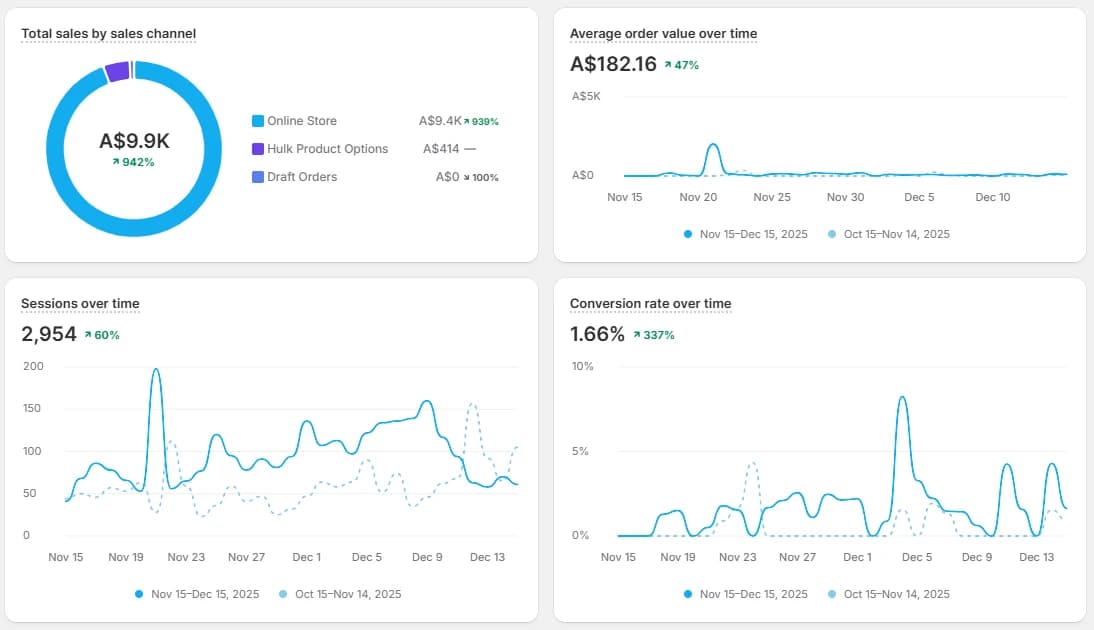
| Online store sales | ~A$905 | A$9,400 | Up 939% |
|---|---|---|---|
| Orders | ~8 | 61 | Up 663% |
| Store conversion rate | ~0.44% | 1.86% | Up 326% |
| Average order value | ~A$124 | A$182.16 | Up 47% |
| Sessions | ~1,828 | 2,961 | Up 62% |
| Cost per conversion, Google Ads | A$76.01 | A$16.69 | Down 78% |
| Average cost per click | A$3.51 | A$1.12 | Down 68% |
| Clicks from search | 557 | 830 | Up 49% |
| Average position in search | 32.2 | 21.1 | Up 11 places |
What it added up to.
Sessions rose by sixty two percent and sales rose by more than nine hundred. The gap between those two numbers is the entire story: the money did not come from finding more people, it came from the people already arriving finally having a reason to buy and spending more when they did.
The funnel says the same thing in detail. Add to cart rose 457 percent, reach checkout rose 533 percent, and completed orders rose 588 percent. The improvement compounds down the path, which is what happens when the problem was the path rather than the traffic.
One number moved the wrong way and it is worth explaining rather than leaving out. The returning customer rate fell by 46 percent, to 7.69 percent. That is because the customer base grew faster than the repeat buying could keep up with: 7.69 percent of sixty one orders is more returning customers than the previous rate was of eight. The proportion fell because the denominator grew.
Where the before column is marked with a tilde, Shopify reports the change rather than the starting figure, so the before is worked back from the change it reports. The after figures and the percentages are as shown in the reporting.
Ready to move the numbers?
Let us talk about your current goals, what is working, what is not, and where the biggest opportunities may be.